

Data Science
Data Science - Python DataFrame
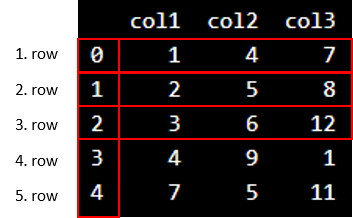
A data frame is a structured representation of data.
We define a data frame with
3 columns and 5 rows
with fictional numbers:
Example
import pandas as pd
d = {'col1':
[1, 2, 3, 4, 7],'col2':
[4, 5, 6, 9, 5], 'col3':
[7, 8, 12, 1, 11]}
df = pd.DataFrame(data=d)
print(df)
Output:
Explaing the Example:
-Import the Pandas library as pd
-Define data with column and rows in a variable named d
-Create a data frame using the function pd.DataFrame()
-The data frame contains 3 columns and 5 rows
-Print the data frame output with the print() function
to activate the DataFrame() function from the Pandas library,
we write pd.
in front of DataFrame()
To Interpret the Output:
"col1", "col2" and "col3" are the names of the columns.
the vertical numbers from 0-4, tell us the information about
the position of the rows.
Note that in Python, the numbering of rows starts with zero.
you can use Python to count the columns and rows.
Example
To Count the number of columns:
count_column = df.shape[1]
print(count_column)
import pandas as pd
d = {'col1': [1, 2, 3, 4, 7], 'col2': [4, 5, 6, 9, 5], 'col3': [7, 8, 12, 1, 11]}
We use df.shape[1] to find the number of columns:
df = pd.DataFrame(data=d)
count_column = df.shape[1]
print("Number of columns:")
print(count_column)
Output:
Number of columns:
3
We use df.shape[0] to find the number of rows:
Example
Count the number of rows:
count_row = df.shape[0]
print(count_row)
import pandas as pd
d = {'col1': [1, 2, 3, 4, 7], 'col2': [4, 5, 6, 9, 5], 'col3': [7, 8, 12, 1, 11]}
df = pd.DataFrame(data=d)
count_row = df.shape[0]
print("Number of rows:")
print(count_row)
Output:
Number of rows:
5
We can use df.shape[1] to find the number of columms:
We can use df.shape[0] to find the number of rows:
<<< previous .
Next >>>.
Professional courses:
participant -Kids, Youths and Adults alike
learn and aquire these professional Courses
Professional Courses:

Are you parents, teachers or affiliate schools, pls. click here.


click here to view 'KITAS' arround you
